Posted In: Hidden by
Dan Howard,
May 9, 2018
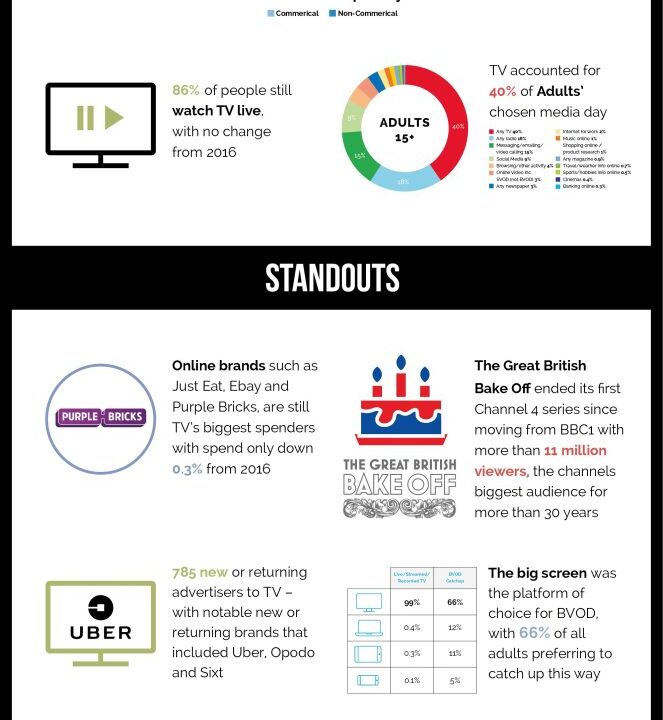
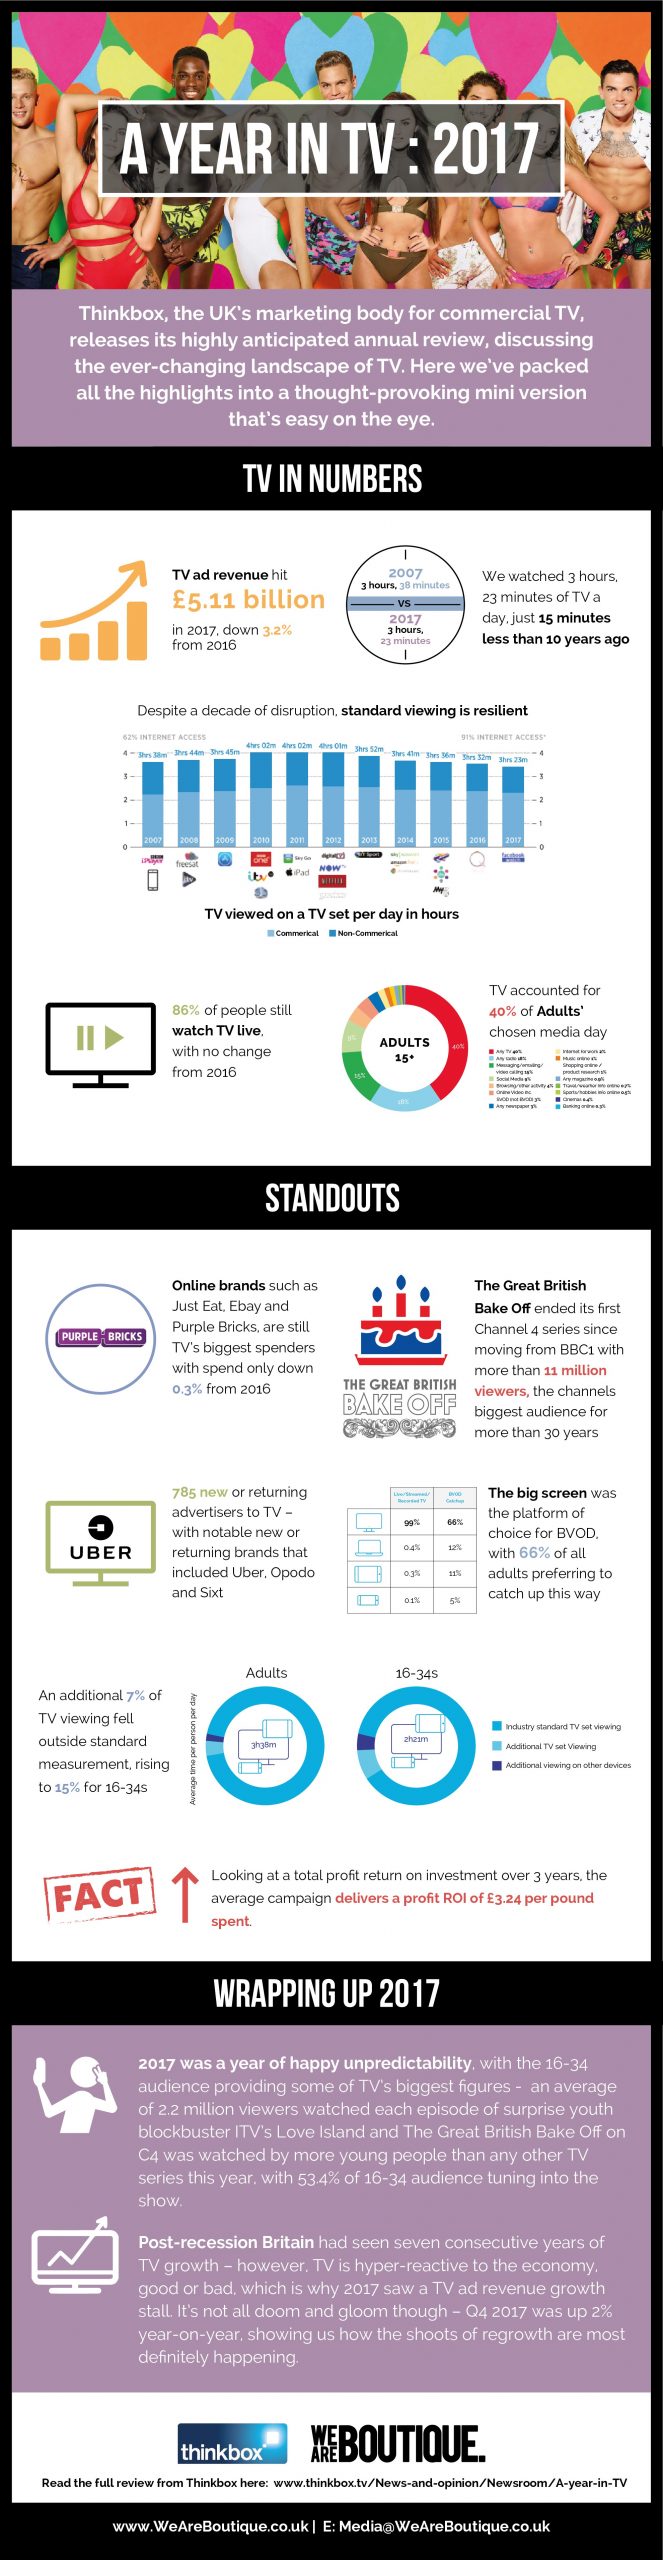
The highly anticipated Thinkbox 2018 report has been released! From our TV-watching habits to which programmes were the most popular, there are lots of interesting stats, all proving that TV is far from dead. We’ve refined the full report and picked out the highlights, turning it into a lovely infographic.
Take a look below or download it here: A Year In TV Infographic 2017
Found it useful? Share it on Twitter and Facebook, tagging @weareboutiqueuk as you go. Let us know what you think!